XGBoost implements machine learning algorithms under the Gradient Boosting framework. We used it at my Dexibit “Big Data” role to look for patterns in data, and now I’m looking at it in more detail for my current VTS role. So it’s time to spin up a little example and see if I can get it to work.
Mission
We’re looking for patterns in data, and I have a pool, which over the summer months is heated. Looking at the electricity consumption figures for my house, can I figure out what days the heater was running ?
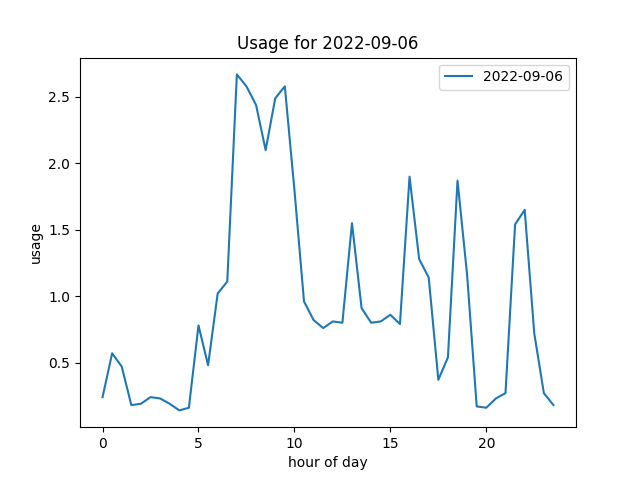
There will be a couple of tells in the data. I run it in the summer months - southern hemisphere, so it’s normally around September to March. It’s on a timer, so I’d expect to see a surge in power at 7am, which at the beginning and end of the summer will last for a while, sometimes all day; but at high summer could only be 30 minutes.
This is an example day when it’s on …
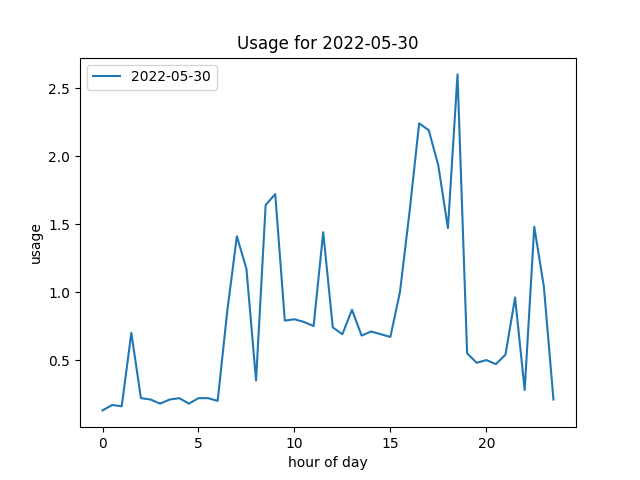
… and this was when it’s off.
Approach
The data from my power company is a simple CSV, which I rearrange into a nice table.
DATE,00:00,00:30,01:00,01:30,02:00,02:30,03:00,03:30,04:00,04:30,05:00,...
2022-01-01,1.65,1.93,1.09,0.22,0.23,0.2,0.24,0.2,...
2022-01-02,0.18,0.41,0.56,0.22,0.16,0.2,0.24,0.14,...
...
And then calculate some “features” … so far I have the day of the year, day of the week, total for the day and then totals for the quadrants of the day. Finally at the end, I have a 1 if I know the heater was on that day, or a 0 if it wasn’t : and I’m basically trying to predict this.
day_of_week,month_of_year,total,dawn,morning,afternoon,night,heater,date,day_of_year
6,1,46.43,2.96,22.86,12.67,7.94,1,2023-01-01,1
0,1,51.73,3.51,27.78,16.03,4.41,1,2023-01-02,2
...
Code
Code is straight forward.
dataset = np.genfromtxt('features/2022/features.csv', delimiter=',', skip_header=1)

X = dataset[:,2:8]
Y = dataset[:,8]

# discussion point here about random seeds
seed = random.randint(0, 100)
test_size = 0.33
X_train, X_test, y_train, y_test = train_test_split(X, Y, test_size=test_size, random_state=seed)

model = XGBClassifier()
model.fit(X_train, y_train)
y_pred = model.predict(X_test)
predictions = [round(value) for value in y_pred]

print('predictions\n{}\n'.format(y_pred[:5]))

accuracy = accuracy_score(y_test, predictions)
print("Accuracy: %.2f%%" % (accuracy * 100.0))
Results
Initial results were very encouraging : 100% ! Then I realized that I had included the day of the year (an integer, 1-365) as a variable for XGBoost to test, and as it’s two continuous ranges of dates (1/1/2022 -> 17/4/2022, 9/5/2022 -> 31/12/2022), XGBoost was able to figure out those ranges and use those. (-‸ლ)
I dropped the the day of the year and it was still pretty good, around 95% until I realized that I was still including the month of the year as well : since it’s on every day in 5-6 months, that’s a good indicator. Removing that dropped it to 67%, which … isn’t bad. This is the model it came up with.
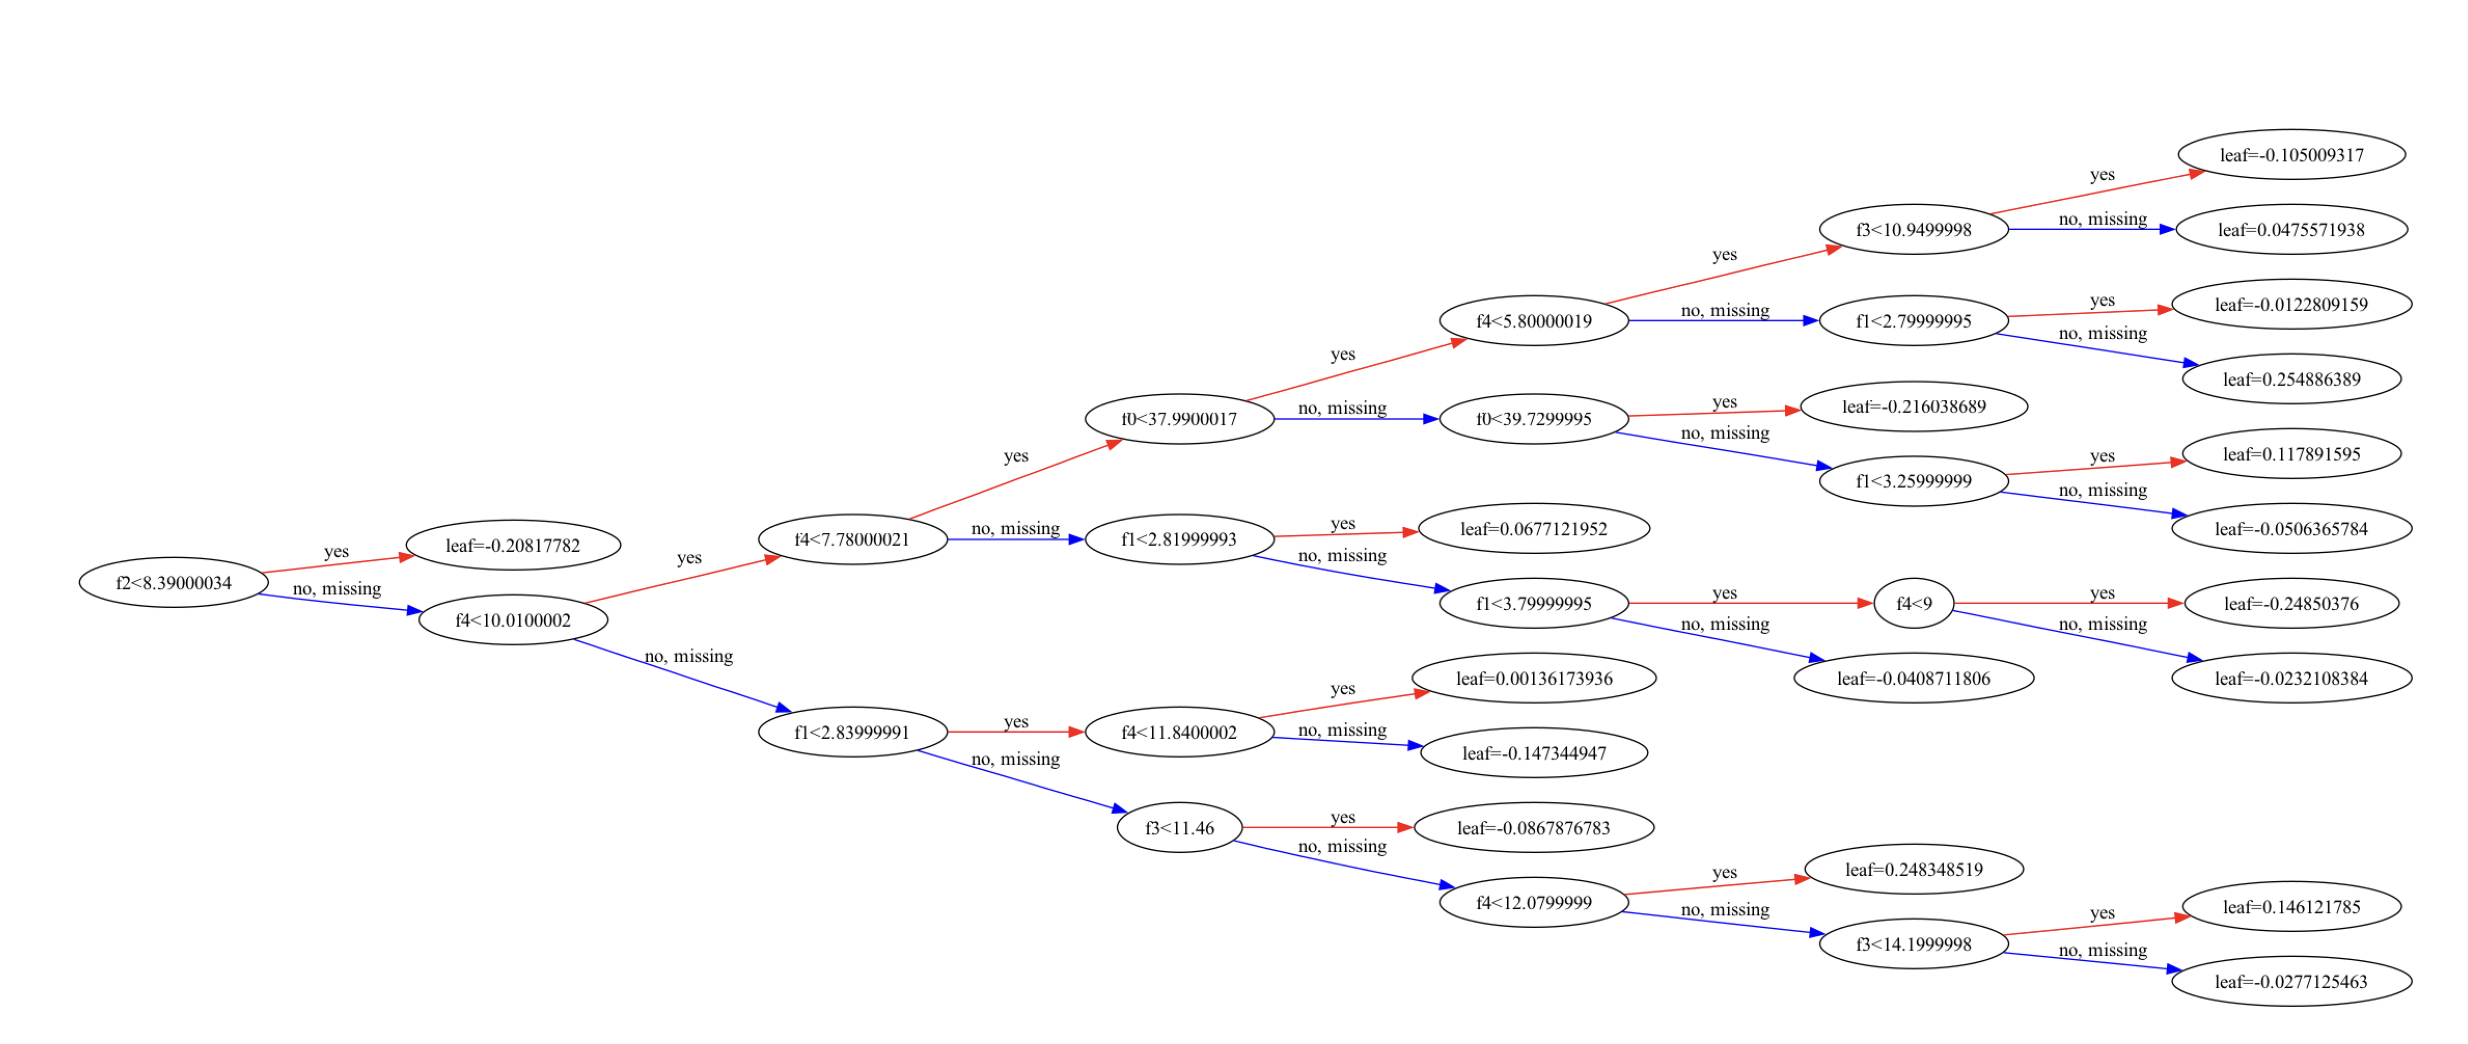
… which shows (I think) that f2, which once I strip the first two columns of the features, is the morning quadrant, when I would expect most power to be used, is the most important feature; then it’s interested in the night (unexpected), then the dawn and night (unexpected) … so XGBoost is teasing out patterns in my data I don’t expect.
And the true test - running it over 2023 data, which it hadn’t seen. The results looked pretty encouraging, showing it mostly ran over summer, and giving reasonable estimates for the start and end dates. Detailed analysis needs to be done - it’s hard to reconcile the data if you don’t include the dates (which give it away) - but at that point, the bar closed.
Conclusions
Remarkably straightforward ? Looking forward to trying this on real data. And doing some more Kaggle exercises.